Normal Probability
Curve
This
bell shaped curve is called as the ‘Normal Probability Curve’. Thus the “graph
of the probability density function of the normal distribution is a continuous
bell shaped curve, symmetrical about the mean” is called normal praobability
curve.
In
statistics it is important because:
(а)
It is the distribution of many naturally occurring variables, such as
intelligence of 8th grade students, height of the 10th grade students etc.
(b)
The distribution of the means of samples drawn from most parent populations is
normal or approximately so when the samples are sufficiently large.
Therefore
normal curve has great significance in social sciences and behavioural
sciences. In behavioural measurement most of the aspects approximates to the
normal distribution. So that Normal Probability Curve or most popularly known
as NPC is used as a reference curve. In order to understand the utility of the
NPC we must have to understand the properties of the NPC.
my audio about NPC
my audio about NPC
Characteristics
of Normal Probability Curve
Some
of the major characteristics of normal probability curve are as follows:
1.
The curve is bilaterally symmetrical.
The curve is symmetrical to its ordinate of the central point of the
curve. It means the size, shape and
slope of the curve on one side of the curve is identical to the other side of the
curve. If the curve is bisected then
its right hand side completely matches to the left hand side.
2. The
curve is asymptotic. The Normal
Probability Curve approaches the horizontal axis and extends from-∞ to + ∞. Means the extreme ends of the curve tends to
touch the base line but never touch it.
3. The
mean, median and mode. The mean,
Median and mode fall at the middle point and they are numerically equal.
4. The
Points of inflection occur at ± 1 Standard deviation unit. The points of influx in a NPC occur at ± 1σ
to unit above and below the mean. Thus
at this point the curve changes from convex to concave in relation to the
horizontal axis.
5. The
total area of npc is divided in to ± standard deviations. The total of NPC is divided into six
standard deviation units. From the center it is divided in to three +ve’
standard deviation units and three —ve’ standard deviation units. Thus ± 3σ of NPC include different number of
cases separately. Between ± 1σ lie the middle 2/3rd cases or 68.26%, between ±
2σ lie 95.44% cases and between ± 3σ lie 99.73% cases and beyond + 3σ only
0.37% cases fall.
6. The
y ordinate represents the height of the normal probability curve. The Y ordinate of the NPC represents the
height of the curve. At the center the maximum ordinate occurs. The height of the curve at the mean or mid
point is denoted as Y0. In order to
determine the height of the curve at any point we use the following formula:
7. It
is unimodal. The curve is having
only one peak point. Because the maximum frequency occurs only at one point.
8. The
height of the curve symmetrically declines.
The height of the curve
decline to both the direction symmetrically from the central point. Means the
M + σ and M — σ are equal if the distance from the mean is equal.
9. The
mean of npc is µ and the standard deviation is σ. As the mean of the NPC represent the
population mean so it is represented by the µ (Meu). The standard deviation of
the curve is represented by the Greek Letter, σ.
10. In
normal probability curve the standard deviation is the 50% larger than the
q. In NPC the Q is generally called
the probable error or PE.
The
relationship between PE and a can be stated as following:
1
PE = .6745σ
1σ
= 1.4826PE
11. The
average deviation about the mean of npc is .798σ. There is a constant relationship between
standard deviation and average deviation in a NPC.
12. The
model ordinate varies increasingly to the standard deviation. In a Normal Probability curve the modal
ordinate varies increasingly to the standard deviation. The
standard deviation of the Normal Probability Curve increases, the modal
ordinate decreases and vice-versa.
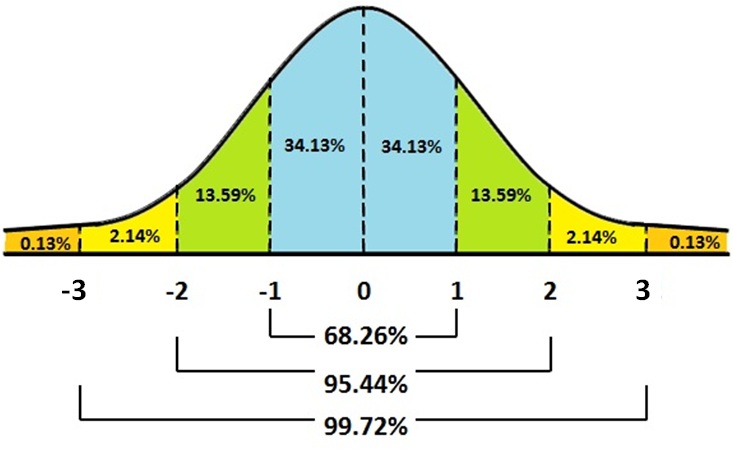
FIGURE1
NORMAL PROBABILITY CURVE
TABLE 1
MERITS AND DEMERITS OF NPC
MEERITS
|
DEMERITS
|
Accqurate For Large Class
|
Not Good To Use For Small Calss
|
Above 200 Students
|
Lessthan 200 Students
|
Healthy
|
Unhealth
|
POWER POINT PRESENTATION ABOUT NPC
